It has been started as a Tango Device server in C++ many years a go, but from a refactoring it have changed to be a python device using PyTango. Also this new release have suffered many changes, specially the one that expands this server to more classes to be able to control, not only scopes, but also Spectrum analysers, Signal generators, and later on Radio frequency generators.
But this device have been more used in this "extensions" than in the original scope class. The Signal generator has been used in the booster tune excitation together with the spectrum analyser in the booster tune measurement (I didn't have time to write about those projects here, I hope soon). This devices works fine and the quality was good enough to change the storage tune measurements to be like the booster ones.
Due to Linac's needs to archive some scope measurements, the scope tango class was improved giving as an output here three posts. This was the real trigger that have launched this device server class.
A few weeks a go, more requests have been receiver about scope acquisition: It has been requested to have available the signal from an FCT in the control system, Also this required to improve the acquisition of the waveform from the scope and after some tries help has been requested to the manufacturer. With this I have reduced the network transition of 40kpoints as 300kB to 80kB or 40kB depending on the float precision. This allows to start polling the scope waveform at 3Hz.
This have boosted the project of the Filling Pattern studies using this FCT signal and a device server is available to perform this calculation. Just now that there is no beam, there is no signal in the FCT, only electronic noise like:

)Instead of the usual signal we have when there is beam:
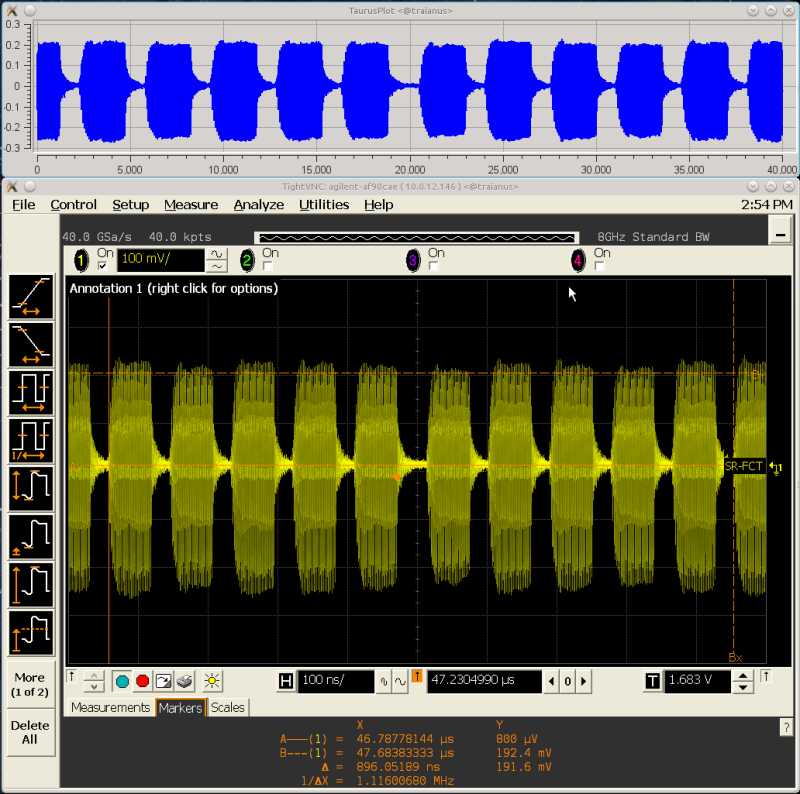
Like often happens I had to ask what this mean and I had try to explain. But, to test the development of the FCT signal analysis, it's necessary to simulate a bit it. No necessary to have the same signal but I should complain that have to change from time to time to have something alive to be analysed.
The solution is to use a simulator of signals, and the best way is using the incredibly versatile PySignalSimulator device server. Creating a device with one property "DynamicAttributes" with something like:
A1=float(READ and VAR('A1') of WRITE and VAR('A1,VALUE)This sets an scalar attribute with a float value that than be read or write. Combining this with an attribute that contains an array of elements:
Channel1=[ (sin(VAR('W1')*x)*sin(VAR('W2')*x)) for x in range(4096)]With those simple lines you can have an spectrum value with a amplitude modulated signal. It's not the same than the beam signal, but it can acts to show how this bunch analyser works.
In the next video, the oscilloscope signal has been simulated using this simulator. You will see it as the top-right blue plot with an amplitude that oscillates between 0 and a maximum. The variables of the formula that simulates this are below this plot, on the left side.
On the left side of the screen some data are revealed about the cpu, memory, network use and so one. After send the Start() command the image below the plot (on its middle) start to collect each one of the waveforms from above. And already with non complete buffer the data is being processed. On the right of this cyclic buffer image representation, there are the attributes to adjust the algorithm and then the output. The green plot on the top is the filtered output.

No comments:
Post a Comment